|
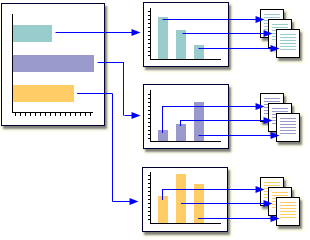
Introduction It is often difficult to convey all of the information that you want to convey in a single plot or chart. Although there might be multiple important relationships among variables, the limits of graphing could mean that your chart omits crucial statistics or variables. One solution is to produce a linked series of charts. The SAS Output Delivery System (ODS) can create HTML pages from SAS procedure output, including SAS/GRAPH software plots and charts. Graphs are saved as GIF files, which are displayed in Web browsers when the ODS HTML output is loaded. Because graphs can contain hypertext links, you can create a chart that leads to additional charts and tables. As shown below, users can click any element of a chart and drill down to another, more detailed chart that displays additional information. |
|
Drill-down charts are not difficult to create, but they require careful planning and coding. They are particularly well suited to periodic reports, when your program can be rerun, with only minor edits, to process updated data. This lesson will lead you through the steps of building a three-layered
network of graphics and tables. When you are finished, you will have
a substantial program that can serve as a template for your own set
of charts.
|
|
2 hours |
|
In this lesson, you learn to
|
|
complete the following lessons:
|